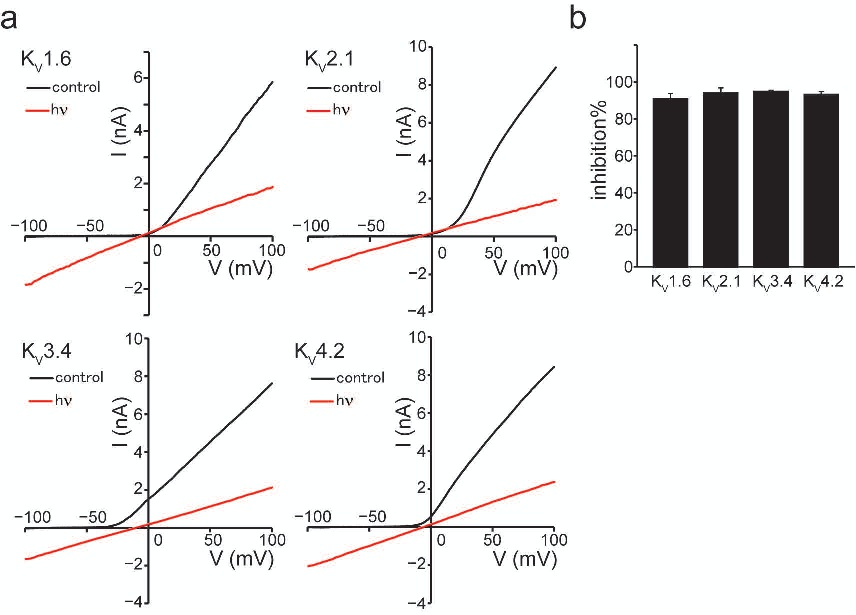
Fig. 5. Photo-induced change in the membrane current of KV overexpressed in PC12 cells. (a) Representative I−V curves are shown for KV1.6, KV2.1, KV3.4, or KV4.2 expressing PC12 cells treated with TC1-loaded cpHDL before illumination (control) and after illumination (hν: 525−550 nm, input power 2 mW cm−2). (b) The averages of the photo-induced percent inhibition in KV current at +100 mV (n = 6-8).